GETTING STARTED
CONTACTS
COMPANIES
DEALS
Integrations
Activities
Other Features
Dashboard & Reports
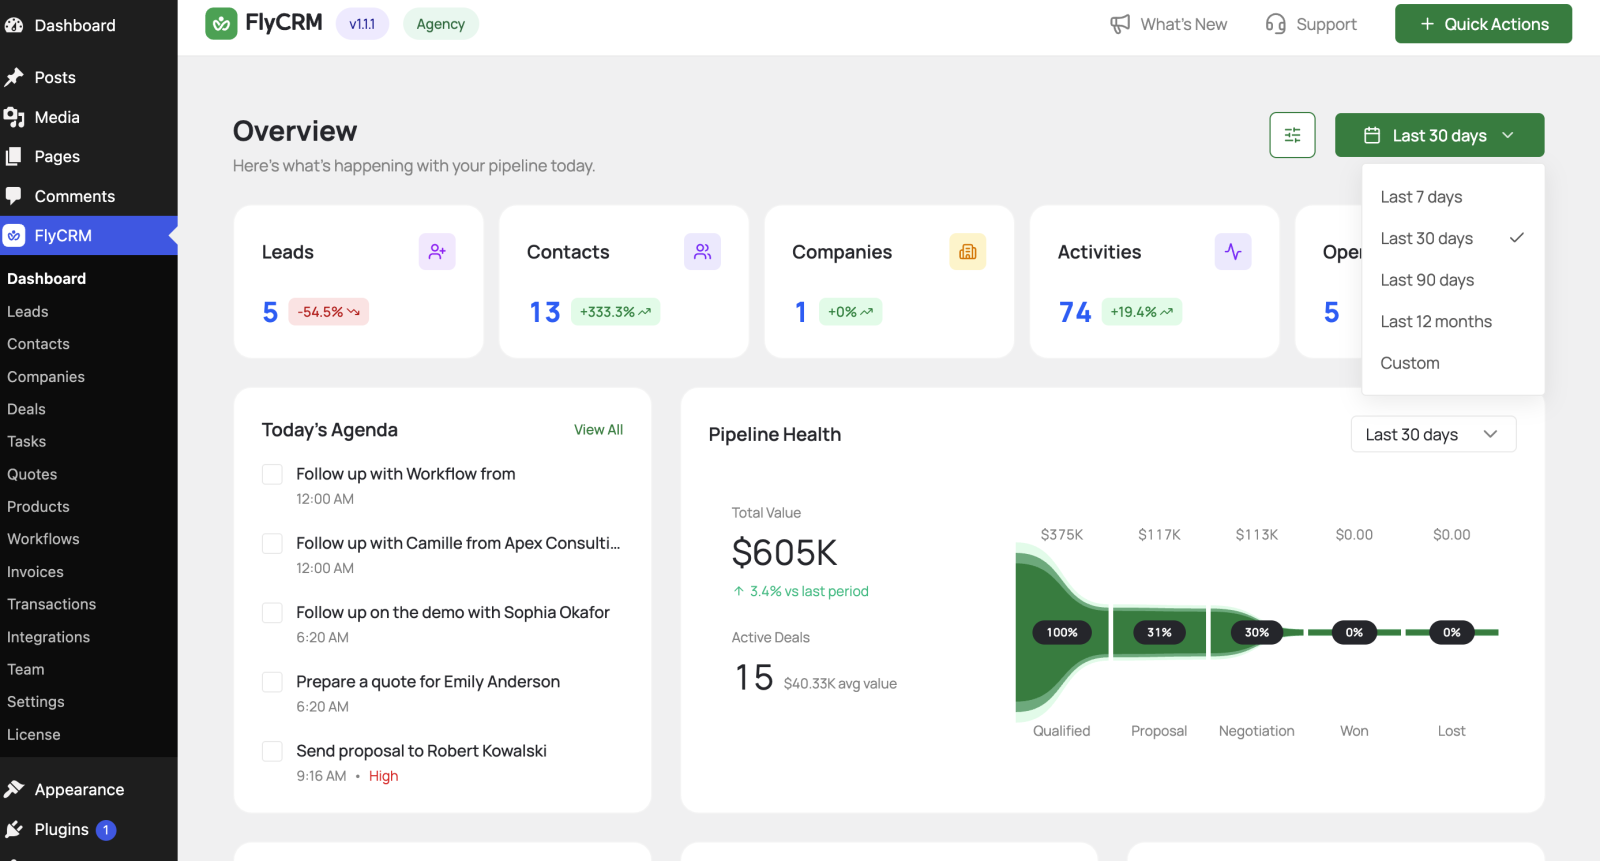
The dashboard gives you a live view of your CRM. This page explains each part and how to read it with a date range.
CRM concept: A dashboard turns raw records into a few numbers you act on. Read it at the start of the day to see what needs attention.
Open the dashboard
Go to FlyCRM > Dashboard. The dashboard loads with your current data.
Read the KPI cards
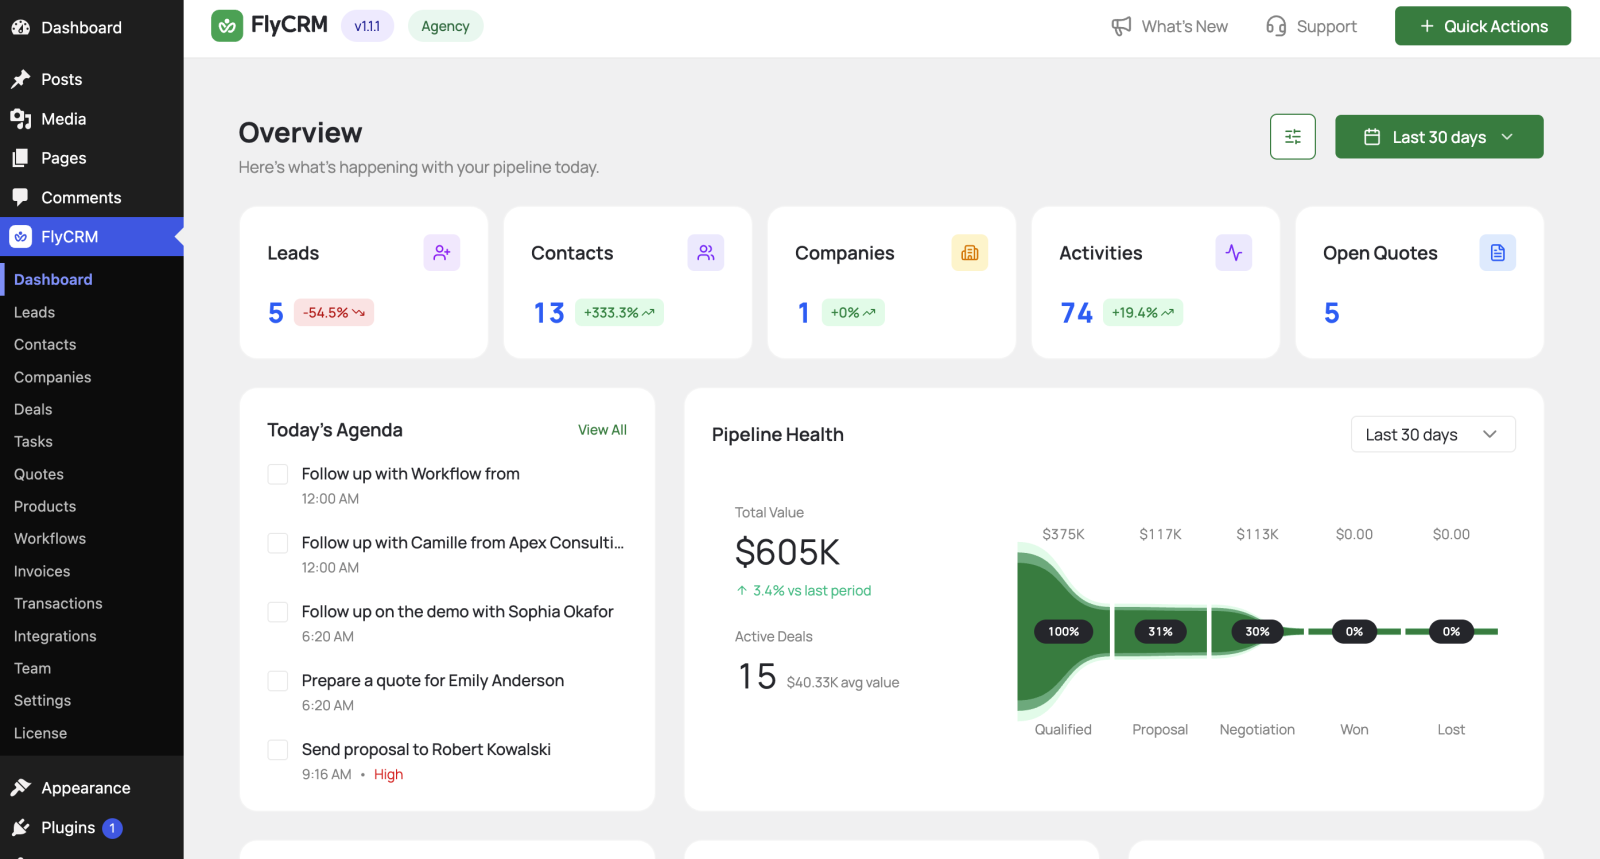
The KPI cards run across the top. Each shows a number and a trend against the period before:
- Contacts — people added in the period.
- Companies — companies with recent activity.
- Activities — calls, emails, and meetings logged.
- Deals — deals in play.
- Won — deals won in the period.
- Tasks — open tasks.
A trend arrow shows whether each number went up or down against the previous period.
CRM concept: A KPI (key performance indicator) is a single number that tracks progress toward a goal. A trend matters more than the number alone — the direction tells you if things are improving.
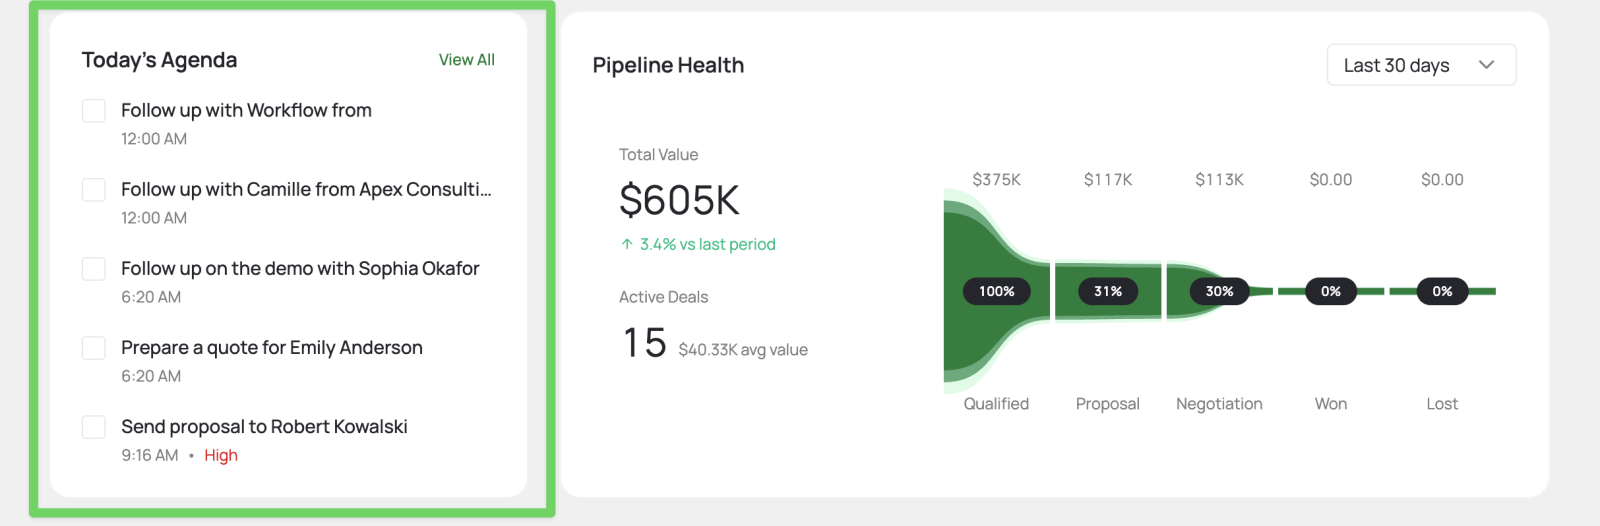
Today's Agenda
The agenda lists the tasks and meetings due today, so you start the day knowing what to do. View All opens the full list. An empty agenda means nothing is due today.
Pipeline Health
Pipeline Health shows your deals as a funnel across the stages of a pipeline. For the chosen pipeline it shows:
- Total value — the summed value of the deals, with a trend against the last period.
- Active deals — how many deals are in play, and their average value.
- A funnel — each stage as a band, with the value and the conversion rate into the next stage.
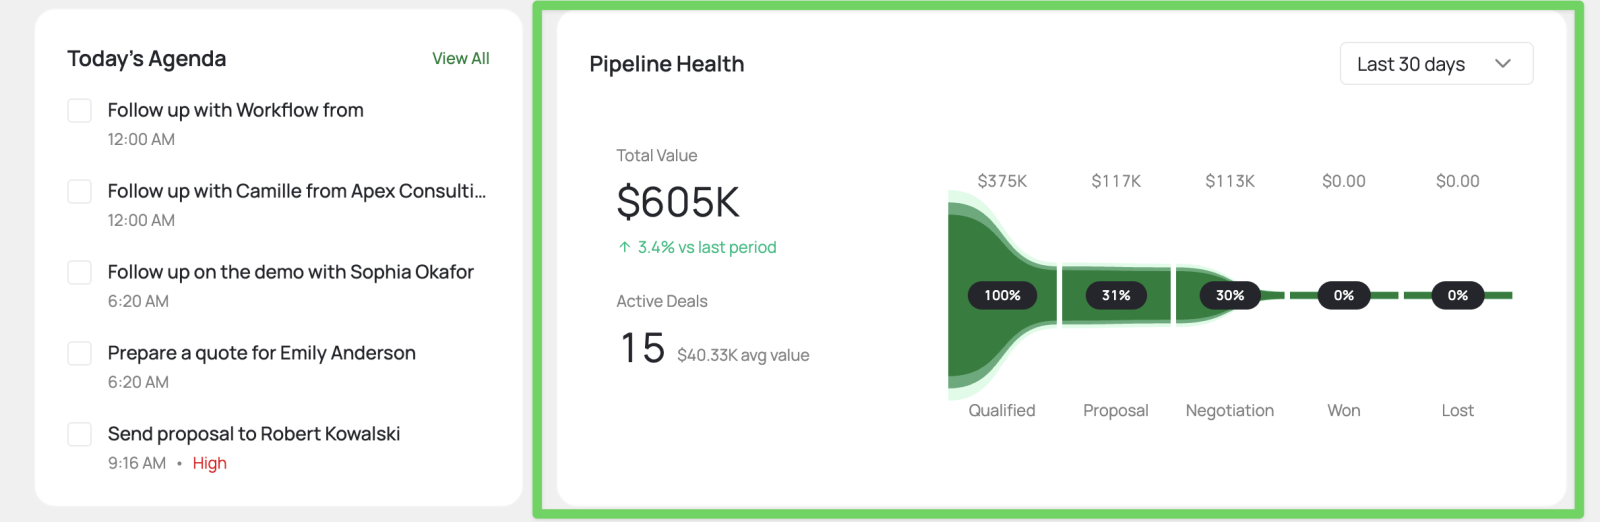
Use it to spot where deals pile up or drop out. Pick a different pipeline from the selector.
CRM concept: A conversion rate is the share of deals that move from one stage to the next. A low rate at one step shows where deals are lost.
Insights and Need Attention
Two panels turn the data into next actions:
- Insights — short, plain-language observations, for example deals likely to close soon or a win rate trending up.
- Need Attention — items that are slipping, for example overdue tasks or deals past their expected close date.
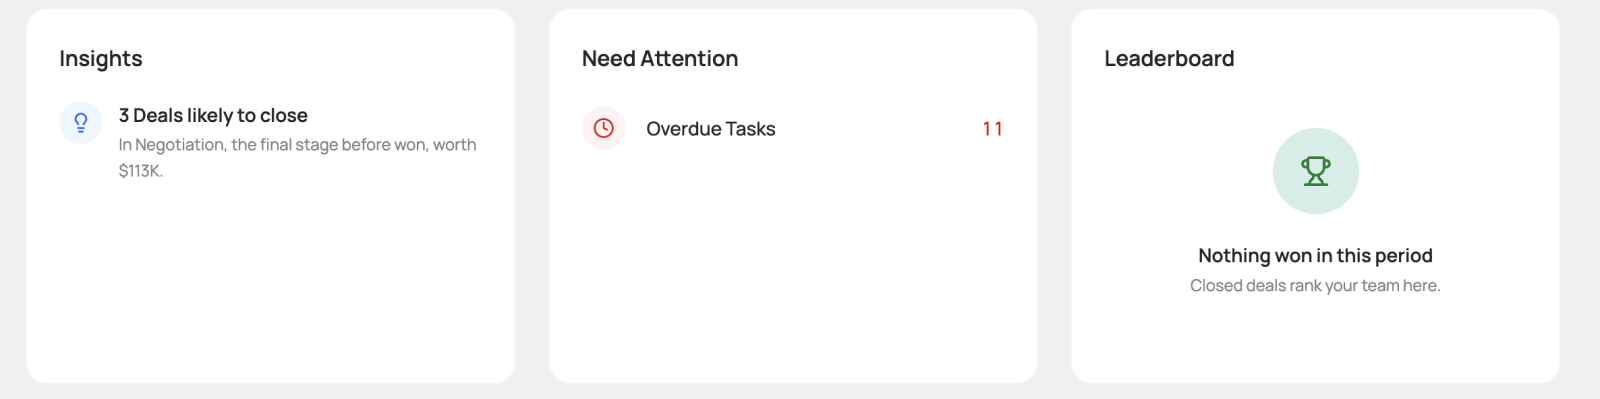
Work from Need Attention first — it lists what is already late.
Filter by date range
Every part of the dashboard follows the date range you choose.
- Select the date-range control at the top right.
- Choose a period, for example Last 30 days.
- The dashboard updates and compares the period to the one before.